Deploy vSphere with Kubernetes (Project Pacific) – Part 6: Some basic testing
This Post is part of a series:
Deploy vSphere with Kubernetes (Project Pacific) – Part 1: Inventory and Design
Deploy vSphere with Kubernetes (Project Pacific) – Part 2: Prepare base networking
Deploy vSphere with Kubernetes (Project Pacific) – Part 3: Prepare base storage (FreeNAS)
Deploy vSphere with Kubernetes (Project Pacific) – Part 4: Install NSX-T
Deploy vSphere with Kubernetes (Project Pacific) – Part 5: Configure NSX-T
–> Deploy vSphere with Kubernetes (Project Pacific) – Part 6: Some basic testing
Deploy vSphere with Kubernetes (Project Pacific) – Part 7: Enable Workload Management
Deploy vSphere with Kubernetes (Project Pacific) – Part 8: Deploy first Workloads
So far in our journey, we spent most of the time on the network, especially on NSX-T. Now, we are actually all set for enabling Workload Management in vCenter. But since NSX-T is such a crucial part of this whole endeavor, I’d like to perform at least some basic functionality tests.
Test Topology
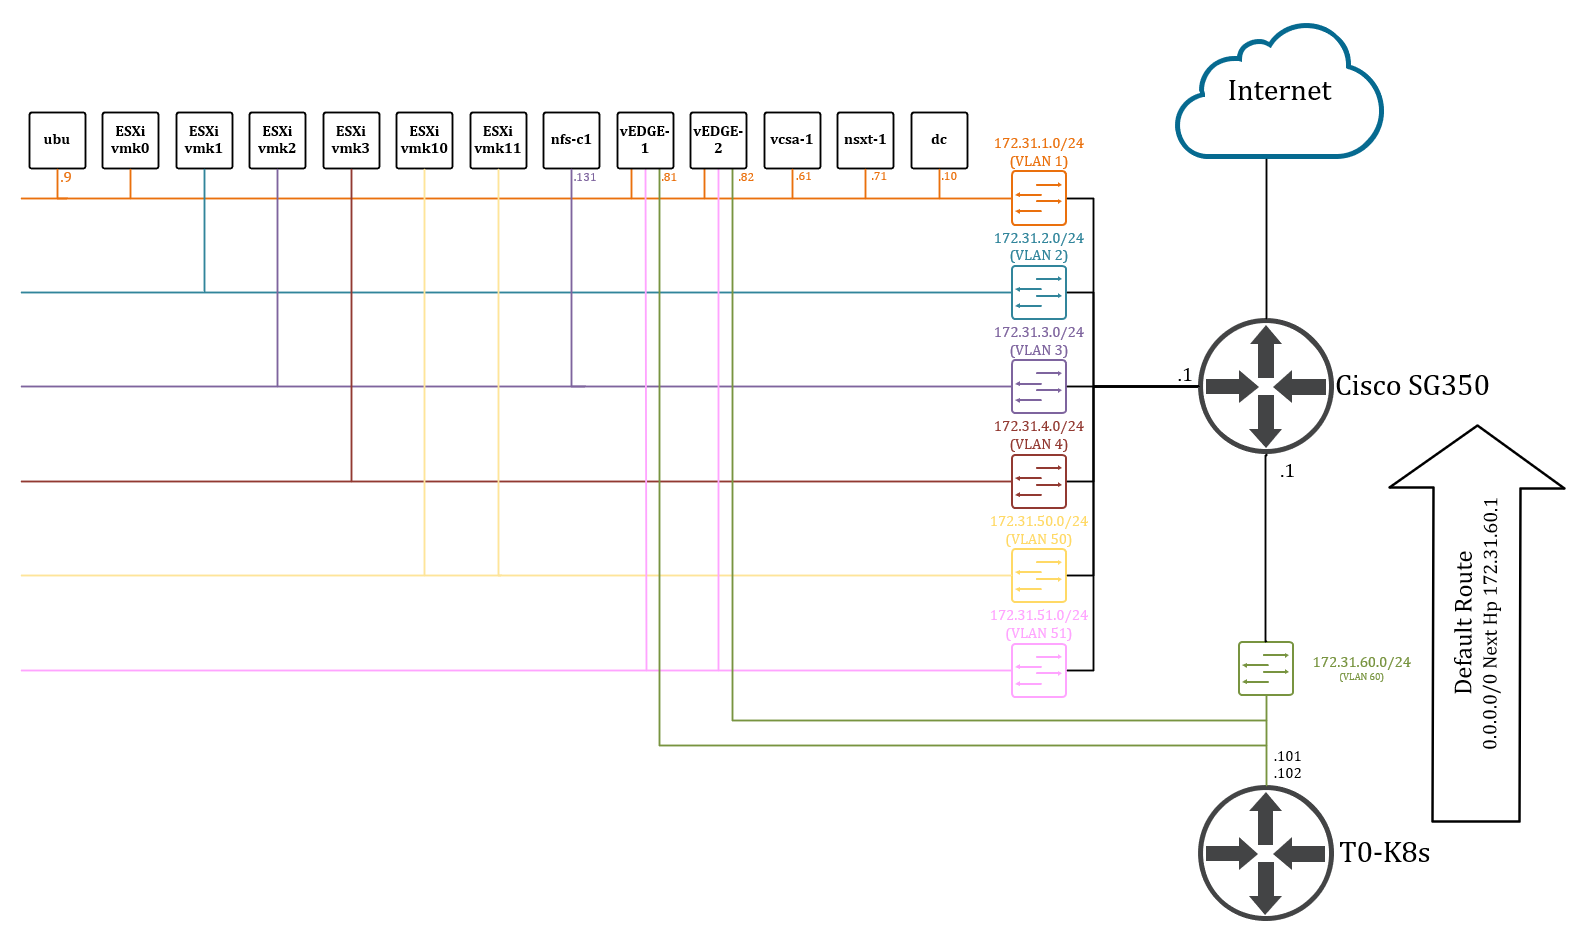
I’ve created a rough sketch with our L2/L3 Network layout. This basically shows, what we have built so far. FYI – VM “ubu” is just a Linux VM which I use. “dc” is my DomainController and DNS Sever.
Test 1 – Connectivity between Cisco SG350 and T0-K8s
Login to Cisco SG350 and ping from source Interface 172.31.60.1 to 172.31.60.101 & 172.31.60.101
cisco-sg300#ping 172.31.60.101 source 172.31.60.1
Pinging 172.31.60.101 with 18 bytes of data:

18 bytes from 172.31.60.101: icmp_seq=1. time=10 ms
18 bytes from 172.31.60.101: icmp_seq=2. time=0 ms
18 bytes from 172.31.60.101: icmp_seq=3. time=0 ms
18 bytes from 172.31.60.101: icmp_seq=4. time=0 ms

----172.31.60.101 PING Statistics----
4 packets transmitted, 4 packets received, 0% packet loss
round-trip (ms) min/avg/max = 0/2/10


cisco-sg300#ping 172.31.60.102 source 172.31.60.1
Pinging 172.31.60.102 with 18 bytes of data:

18 bytes from 172.31.60.102: icmp_seq=1. time=20 ms
18 bytes from 172.31.60.102: icmp_seq=2. time=0 ms
18 bytes from 172.31.60.102: icmp_seq=3. time=0 ms
18 bytes from 172.31.60.102: icmp_seq=4. time=0 ms

----172.31.60.102 PING Statistics----
4 packets transmitted, 4 packets received, 0% packet loss
round-trip (ms) min/avg/max = 0/5/20
cisco-sg300#
Success!
This confirms connectivity from our physical network to the virtual interfaces of the T0-K8s Service Router(s).
Test 2 – Connectivity from MGMT Network to T0-K8s
In this test, I wanna see, whether the routing on my Cisco SG350 works.
To test this, I’ll use my Ubuntu VM (ubu, 172.31.1.9) inside my Management network and try to reach the T0-K8s Interfaces (you can also use the vCenter or even the NSX-T VM, as they are sitting in the same network).
Check the Routing table of Cisco SG350:
cisco-sg300#show ip route
Maximum Parallel Paths: 1 (1 after reset)
IP Forwarding: enabled
Codes: > - best, C - connected, S - static


S   0.0.0.0/0 [1/4] via 172.16.0.1, 40:07:22, vlan 150
C   172.16.0.0/29 is directly connected, vlan 150
C   172.31.1.0/24 is directly connected, vlan 1
C   172.31.2.0/24 is directly connected, vlan 2
C   172.31.3.0/24 is directly connected, vlan 3
C   172.31.4.0/24 is directly connected, vlan 4
C   172.31.50.0/24 is directly connected, vlan 50
C   172.31.51.0/24 is directly connected, vlan 51
C   172.31.60.0/24 is directly connected, vlan 60
cisco-sg300#
Looks good – all VLANs are showing up in the routing table. You can ignore the static route in line 7, this is for connectivity into my home network.
Let’s do a traceroute from ubu to T0-K8s:
cloudborn@ubu:~$ traceroute 172.31.60.101
traceroute to 172.31.60.101 (172.31.60.101), 30 hops max, 60 byte packets
 1  _gateway (172.31.1.1)  2.974 ms  3.531 ms  4.950 ms
 2  172.31.60.101 (172.31.60.101)  5.478 ms  5.553 ms  5.753 ms
[root@cesxi1:~]
Success! Also, you can see, that the first hop was the Cisco SG350’s IP.
Test 3 – VTEP Connectivity
Next, I want to check the connectivity between the VTEPs (ESXi and EDGES) with an MTU bigger than 1500.
First, we need the VTEP IPs.
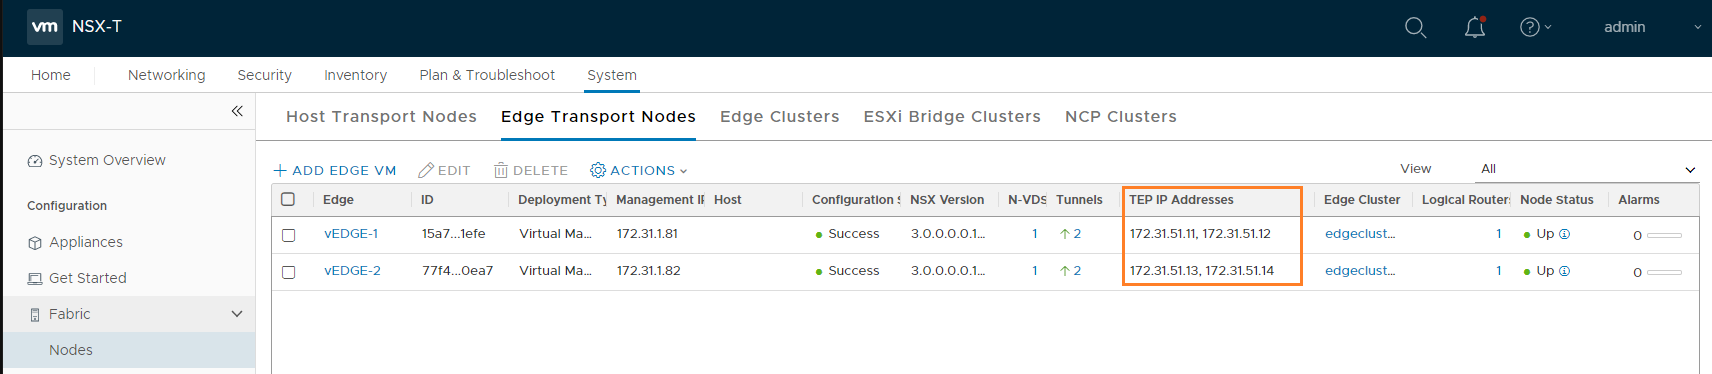
For the EDGEs, you can find the configured IPs under System –> Fabric –> Nodes –> Edge Transport Nodes
FoFor the EDGEs, you can find the configured IPs under System –> Fabric –> Nodes –> Host Transport Nodes
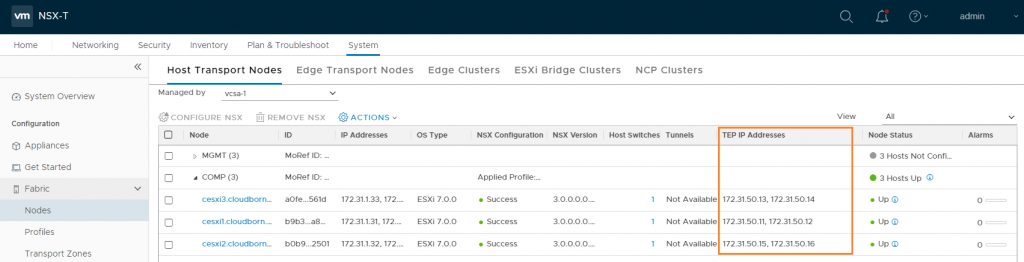
By the way, our ESXi Transport nodes have two IPs each, because they have two Uplinks in their Uplink Profile configured.
To test the connectivity, I’ll SSH to host cesxi1 and ping from there.
Remember, the vmk10 and vmk11 interfaces are not sitting in the defaultTcpipStack, but in the vxlan netstack
[root@cesxi1:~] esxcli network ip netstack list
defaultTcpipStack
   Key: defaultTcpipStack
   Name: defaultTcpipStack
   State: 4660

vxlan
   Key: vxlan
   Name: vxlan
   State: 4660

hyperbus
   Key: hyperbus
   Name: hyperbus
   State: 4660
[root@cesxi1:~] esxcli network ip interface ipv4 get -N vxlan
Name   IPv4 Address  IPv4 Netmask   IPv4 Broadcast  Address Type  Gateway  DHCP DNS
-----  ------------  -------------  --------------  ------------  -------  --------
vmk10  172.31.50.11  255.255.255.0  172.31.50.255   STATIC        0.0.0.0     false
vmk11  172.31.50.12  255.255.255.0  172.31.50.255   STATIC        0.0.0.0     false
[root@cesxi1:~]
Let’s do a vmkping to one of cesxi2’s VTEPs (172.31.50.15):
[root@cesxi1:~] vmkping -S vxlan -I vmk10 -s 1572 -d 172.31.50.15
PING 172.31.50.15 (172.31.50.15): 1572 data bytes
1580 bytes from 172.31.50.15: icmp_seq=0 ttl=64 time=0.596 ms
1580 bytes from 172.31.50.15: icmp_seq=1 ttl=64 time=0.585 ms
1580 bytes from 172.31.50.15: icmp_seq=2 ttl=64 time=0.578 ms

--- 172.31.50.15 ping statistics ---
3 packets transmitted, 3 packets received, 0% packet loss
round-trip min/avg/max = 0.578/0.586/0.596 ms

[root@cesxi1:~]
Let’s decrypt this vmkping:
vmkping -S vxlan -I vmk10 -s 1572 -d 172.31.50.15
-S vxlan –> use netstack called “vxlan” to run this ping from
-I vmk10 –> use vmk10 as source interface (has to be located on the specified netstack)
-s 1572 –> set the packet size, here 1572 (which is the maximum, since we have configured an MTU of 1600 everywhere)
-d –> means, don’t fragment the packet; if we don’t set this flag, the packet might get fragmented into smaller chunks that fit the actual MTU on the network. That way, we wouldn’t notice any MTU missconfigurations with this test
172.31.50.15 –> the target IP (cesxi2 vmk10 in this case)
This test was successful. Of course, we have to ping every other VTEP IP (ESXi and EDGEs) too. And then again with vmk11 as source. I’m not going to spam all the output here – in my case, everything was successful 🙂
There is a lot more we could test. But confirming basic connectivity, including correct MTU settings is enough for me now. Also, I want to finally deploy Workload Management! =D
Next Up – Enable Workload Management